-
10 minutes to pandas - Pivot Tables데이터 분석/Pandas 2022. 4. 1. 00:07
Pivot
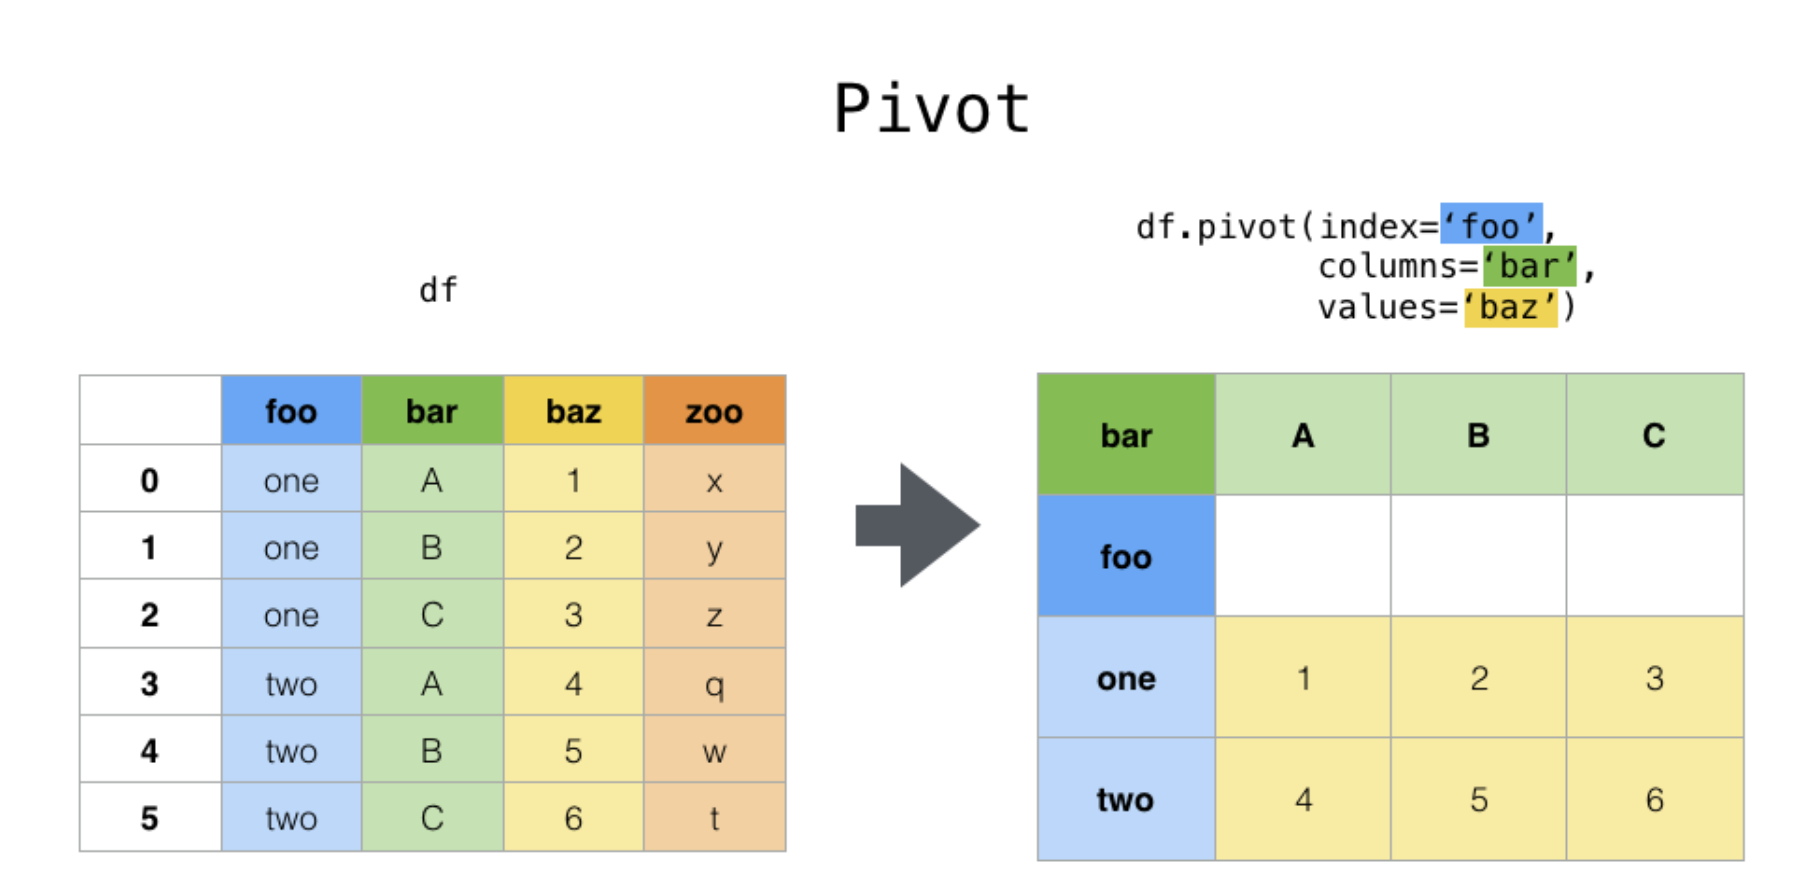
# 예시
pivoted = df.pivot(index="foo", columns="bar", values="baz")

# 일반적인 용법
pivoted = df.pivot(index="date", columns="variable", values="value")
pivot() will error with a ValueError: Index contains duplicate entries, cannot reshape
if the index/column pair is not unique.
In this case, consider using pivot_table()
which is a generalization of pivot that can handle duplicate values for one index/column pair.Stack / UnStack
stack: column 차원을 index 로 보낸다.
unstack: index 차원을 column 으로 보낸다.
차원을 명시하지 않을 경우 가장 안쪽의 차원을 가장 안쪽의 차원으로 보낸다!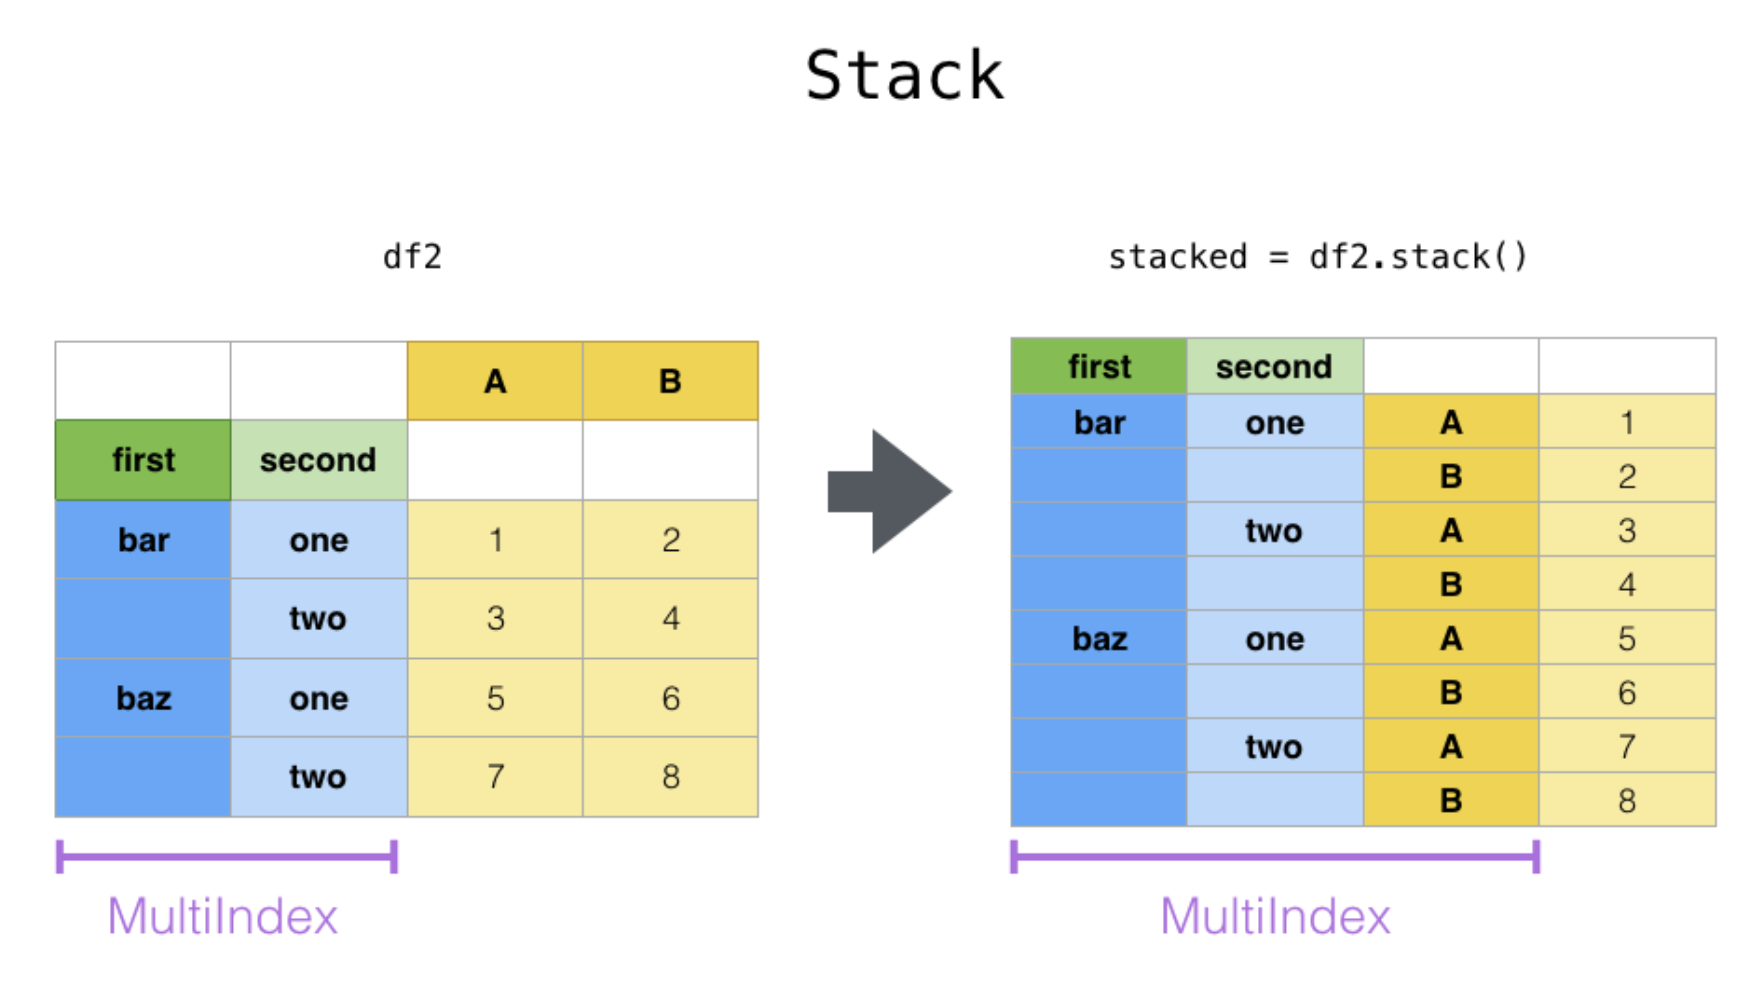

- stack(): “pivot” a level of the (possibly hierarchical) column labels, returning a DataFrame with an index with a new inner-most level of row labels.
- unstack(): (inverse operation of stack()) “pivot” a level of the (possibly hierarchical) row index to the column axis, producing a reshaped DataFrame with a new inner-most level of column labels.
Melt
identifier column (first, last) 를 식별자로 pivot한다.
non-identifier columns (heifght, weight) 에 대해 variable 에 컬럼명, value 칼럼에 값으로 구성하였다.
Pivot Table (aka. spreadsheet-style pivot tables)
pandas also provides pivot_table() for pivoting with aggregation of numeric data.
data, index, columns, value, aggfunc
import datetime df = pd.DataFrame( { "A": ["one", "one", "two", "three"] * 6, "B": ["A", "B", "C"] * 8, "C": ["foo", "foo", "foo", "bar", "bar", "bar"] * 4, "D": np.random.randn(24), "E": np.random.randn(24), "F": [datetime.datetime(2013, i, 1) for i in range(1, 13)] + [datetime.datetime(2013, i, 15) for i in range(1, 13)], } ) pd.pivot_table( df, index= 'B', columns= 'A', values="D", aggfunc=np.sum ) pd.pivot_table( df, index=pd.Grouper(freq="M", key="F"), columns="C", values="D" )'데이터 분석 > Pandas' 카테고리의 다른 글
Pandas 집계 - pivot_table vs. groupby (0) 2022.08.15 pandas.DataFrame.replace, where, mask (0) 2022.05.24 10 minutes to pandas - Reshaping (0) 2022.03.30 10 minutes to pandas - Group by (split - apply - combine) (0) 2022.03.29 10 minutes to pandas - Merge & Join (0) 2022.03.27